Your spectacular guide to retail Halloween sales statistics.

Welcome to your spectacular (and somewhat scary) guide to retail Halloween sales statistics. Discover everything merch-related about this time of year, from what customers buy to average household spend!
How much are American households spending on Halloween?
U.S. household spending on Halloween is increasing. According to statistics from the National Retail Foundation, Americans spent a massive $10.6 billion on the holiday in 2022, a significant increase from the previous year.
How did the spending break down? As it turns out, pretty evenly across categories. The industry body estimates that Americans dropped $3.6 billion on costumes, $3.1 billion on candy, $3.4 billion on decorations, and $0.6 billion on greeting cards in 2022.
Interestingly, though, there were some differences in priorities compared to preceding years. 67% said they planned on handing out candy in 2022, compared to just 62% in 2020 and 69% in 2019. And 28% said they would throw or attend a party, up from 22% in 2020 but down from 32% in 2019.
Given these statistics, the average American spent $100.45 on Halloween in 2022 on various supplies and costumes. Total spending across all households was $29.51 for the year.
How many American homes participate in Halloween?
The number of American homes participating in various Halloween celebrations dropped significantly after 2020. However, it has been on the rise since then.
According to National Retail Foundation data, Halloween-related activities resumed to pre-pandemic levels in 2022. 69% of consumers said they would participate in the festival in some way, slightly up from the 68% figure in 2019. For comparison, the figure was 65% in 2021. Estimates suggest that 171 million homes participated in various Halloween celebrations in 2022.
Halloween spending statistics.
Understanding Halloween spending statistics is essential for anyone with a retail merchant account. Spending through a point-of-sale terminal or contactless card reader can generate tremendous seasonal income, particularly for online retailers and seasonal sellers.
Given the current economic environment, 40% of Halloween shoppers relied more heavily on discount stores, according to survey data. Thrift stores and various resale shops were popular among 10% of shoppers, with around 3% buying from catalogs.
Buyers want bargains. To this end, 45% began shopping for Halloween items in September or earlier last year. And only 16% of people wait until the last two weeks of October to begin.
Of the $100 or so households spent on Halloween last year, $29.51 went to candy, $31.89 went to decorations, $33.75 went to costumes, and $5.30 went to greeting cards. While candies were traditionally the highest-spend item, more money flowed toward costumes and decorations, which now comprise more than half of the entire budget.
Candy prices saw significant inflation between 2021 and 2022, rising 13% for the year. Manufacturers are trying to address this by shrinking portion sizes, with mixed results. As such, overall candy demand is lower than it would have been without these changes.
Online Halloween sales are also exploding. 31% of consumers said they shopped online in preparation for the festival.
The characteristics of Halloween consumers.
Households with children took the lead on Halloween spending in 2021, clocking up an impressive $149.69 of overall spending, more than 45.7% higher than the average consumer. By contrast, those without children only spent $73.57, a relatively modest amount for the season, only 49.1% percent of the level of their child-rearing counterparts.
In terms of age groups, those 35 to 44 tended to display the most Halloween spending. These individuals set aside an average budget of $149.34, outpacing other groups by a whopping 14.4%. By contrast, consumers over the age of 65 maintained a more modest Halloween budget of $57.07.
Interestingly, purchasing patterns also varied considerably within age groups. Those over the age of 65 were least likely to splurge on costumes, underspending the average consumer by 40.7%. As such, younger people were much more likely to dress up for the occasion, highlighting the differences between the two groups.
Finally, point of sale terminal spending varied according to region. Those living in the Southern states have more Halloween spirit than those in more Northern ones. Households in this region spent an average of $106.64 on the season, 2.97% more than the rest of the country, despite lower disposable incomes.
Midwesterners spent the least on Halloween. Figures suggest they only set aside $95.60 for the season, around 4.65% less than other regions.
Where are people spending their money on Halloween?
As briefly discussed, most people are spending the majority of their Halloween budgets on candy, costumes, and décor for their homes and front porches.
Data suggests Halloween enthusiasts spent over $707.98 million on various Halloween symbols in 2021, with the average decoration budget growing by 27.2% between 2018 and 2022. As part of this, pumpkin sales are also rising sharply by 19.4%, despite a 17.2% price increase during those same years.
Costume extravagance also continues to rise. Spooky celebrants dropped more than $3.6 billion on costumes for 2022, representing a 9.09% increase over the previous year. Adult costumes raked in over $1.7 billion, which totaled more than 47.2% of overall expenditure compared to 2021.
Children’s costumes also generated around $1.2 billion for seasonal brick-and-mortar and online retailers, representing only a third of total sales. That’s a change from previous years when kids’ clothes dominated.
Even the market for pet costumes is growing. Households spent a massive $700 on costumes for their four-legged companions in 2022, representing nearly 20% of total costume expenditure.
Final remarks.
In summary, Halloween is back. Merchants are doing business and consumers are buying again, trying to make up for lost time. In many areas, the size of the market is at or above where it was in 2019.
Related Reading
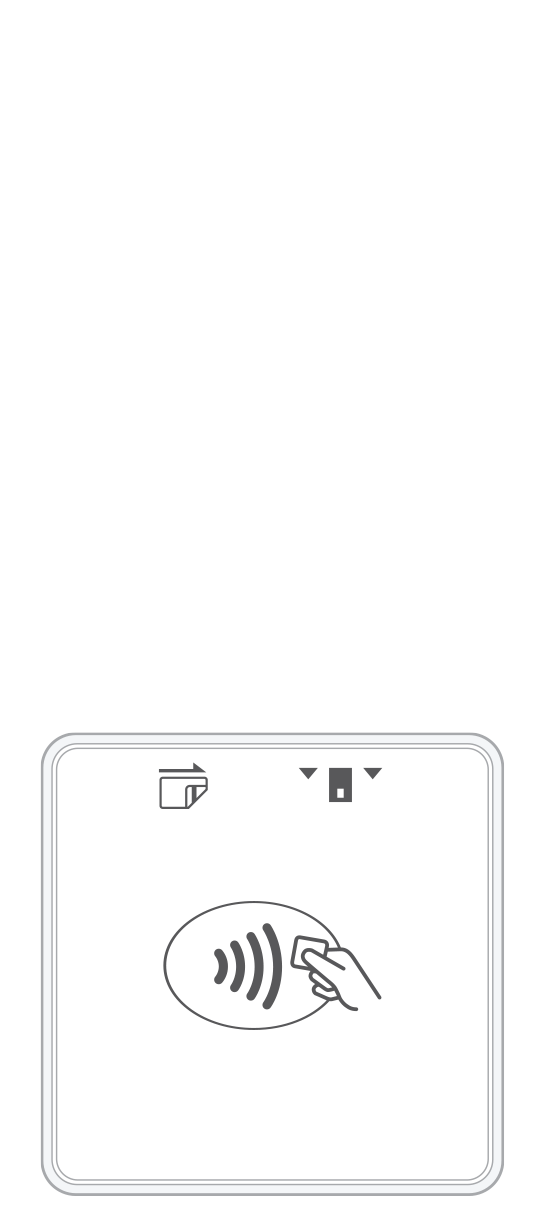
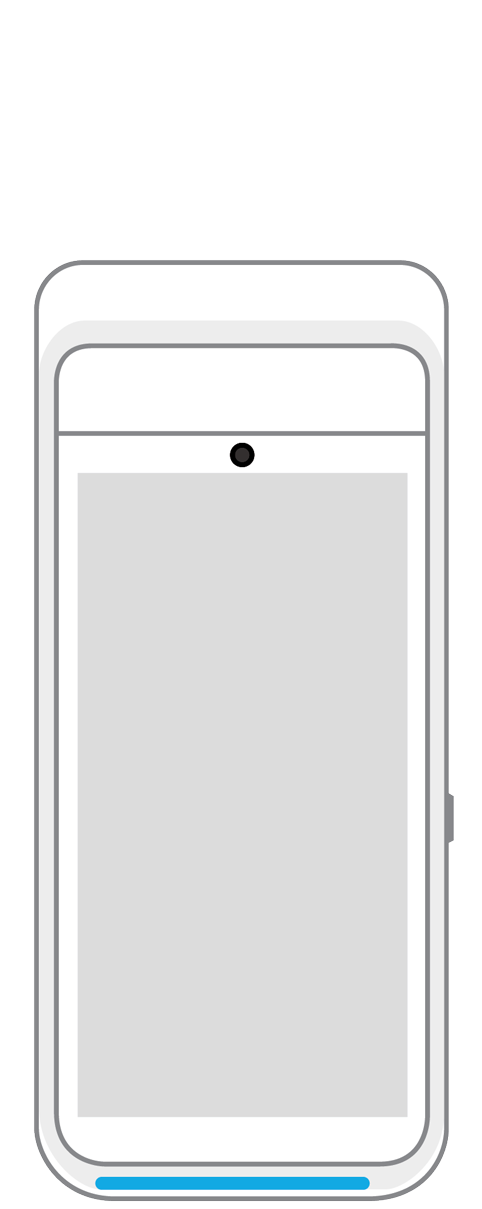
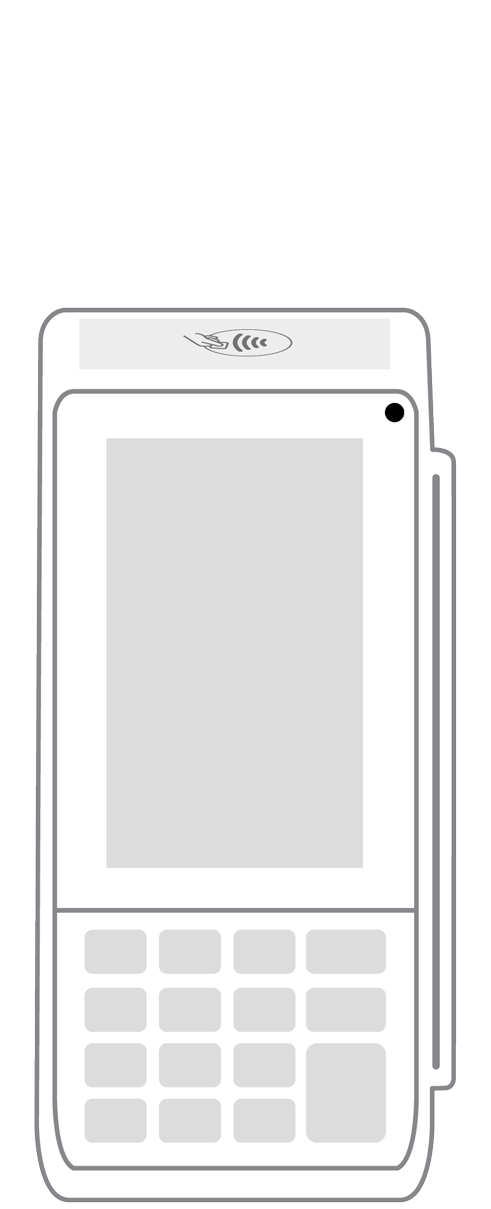
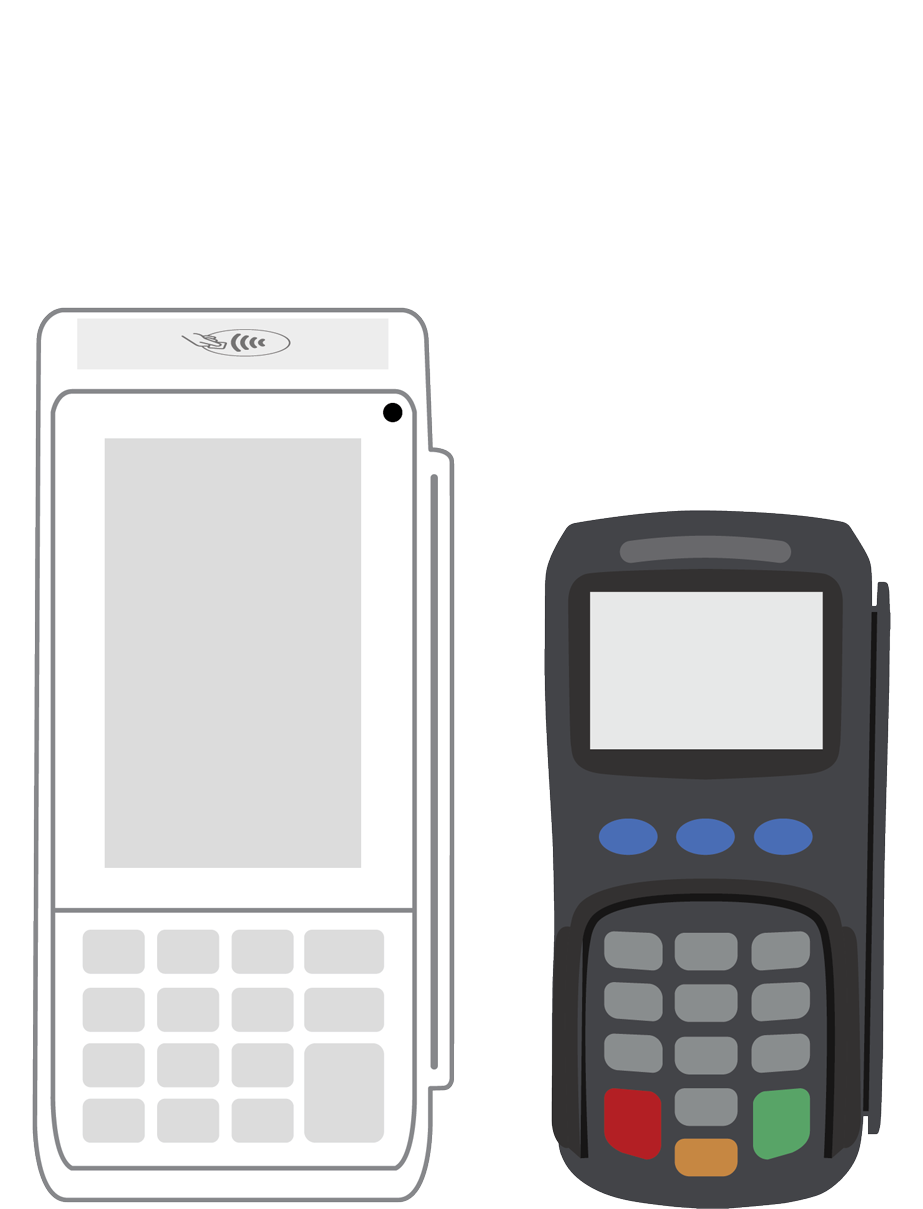
 3-in-1 Reader |  Terminal |  Keypad |  PINPad Pro |  Flex |  POS+ | |
|---|---|---|---|---|---|---|
Payment types | ||||||
EMV chip card payments (dip) | ||||||
Contactless payments (tap) | ||||||
Magstripe payments (swipe) | ||||||
PIN debit + EBT | ||||||
Device features | ||||||
Built-in barcode scanner | ||||||
Built-in receipt printer | ||||||
Customer-facing second screen | ||||||
External pinpad | ||||||
Wireless use | ||||||
Network | ||||||
Ethernet connectivity | With dock | |||||
Wifi connectivity | ||||||
4G connectivity | ||||||
Pricing | ||||||
Free Placement | ||||||